TL;DR #
If you’re sourcing children’s face cream and your supplier hands you a safety data sheet with no mention of packaging migration testing, that’s a gap worth flagging before you place your first order. Endocrine-disrupting compounds (EDCs) — specifically bisphenols and alkylphenols — don’t just appear in formulations as intentional ingredients. They migrate. From the plastic jar. From the cap. From the inner liner. And the regulatory window is tightening in ways that many procurement teams haven’t fully caught up with yet.
The 13 compounds covered in this analysis — BPS, BPF, BPE, BPA, BPB, BPAP, BPZ, TCBPA, TBBPA, octylphenol (OP), nonylphenol (NP), 4-n-octylphenol (4-n-OP), and 4-n-nonylphenol (4-n-NP) — represent the full bisphenol and alkylphenol risk profile relevant to creams packaged in standard polycarbonate, ABS, or recycled-content plastics. These aren’t obscure trace contaminants. They’re structurally similar to estrogen, and long-term low-level exposure has been linked to endocrine disruption in children, including premature puberty and developmental interference.
This article walks through a validated LC-MS/MS detection method, migration behavior data, and what the results from a 50-batch real-sample audit actually look like — so buyers can assess what to ask for from their formulation and packaging partners before products reach market.
Endocrine Disruptor Residue in Children’s Cream: Regulatory Status and Detection Scope #
China’s Cosmetic Safety Technical Specification (化妆品安全技术规范) explicitly prohibits BPA, nonylphenol, and branched-chain 4-nonylphenol in finished cosmetic products. The EU Cosmetics Regulation EC No. 1223/2009 carries analogous restrictions under its banned substances annex. What neither regulation currently mandates with sufficient granularity is packaging migration testing — that is, the transfer of prohibited substances from the container into the product over time.
This is the regulatory blind spot that matters most in children’s cream procurement. Most audits stop at formula testing. But when the packaging is made from resins containing NP or bisphenol-based stabilizers, those compounds migrate into the cream matrix regardless of how clean the formulation is.
Most procurement teams don’t realize that the current standard landscape for cosmetic packaging migration is fragmented. Migration testing in food contact materials is relatively mature under GB/T 5009 and EU frameworks, but for cosmetics, you’re largely working by analogy. The referenced migration methodology in this work draws on GB/T 38420-2019 as the closest applicable framework — full immersion, at a ratio of 10 g cream per 1 cm² contact area — and the results are instructive even if the standard wasn’t written expressly for face cream.
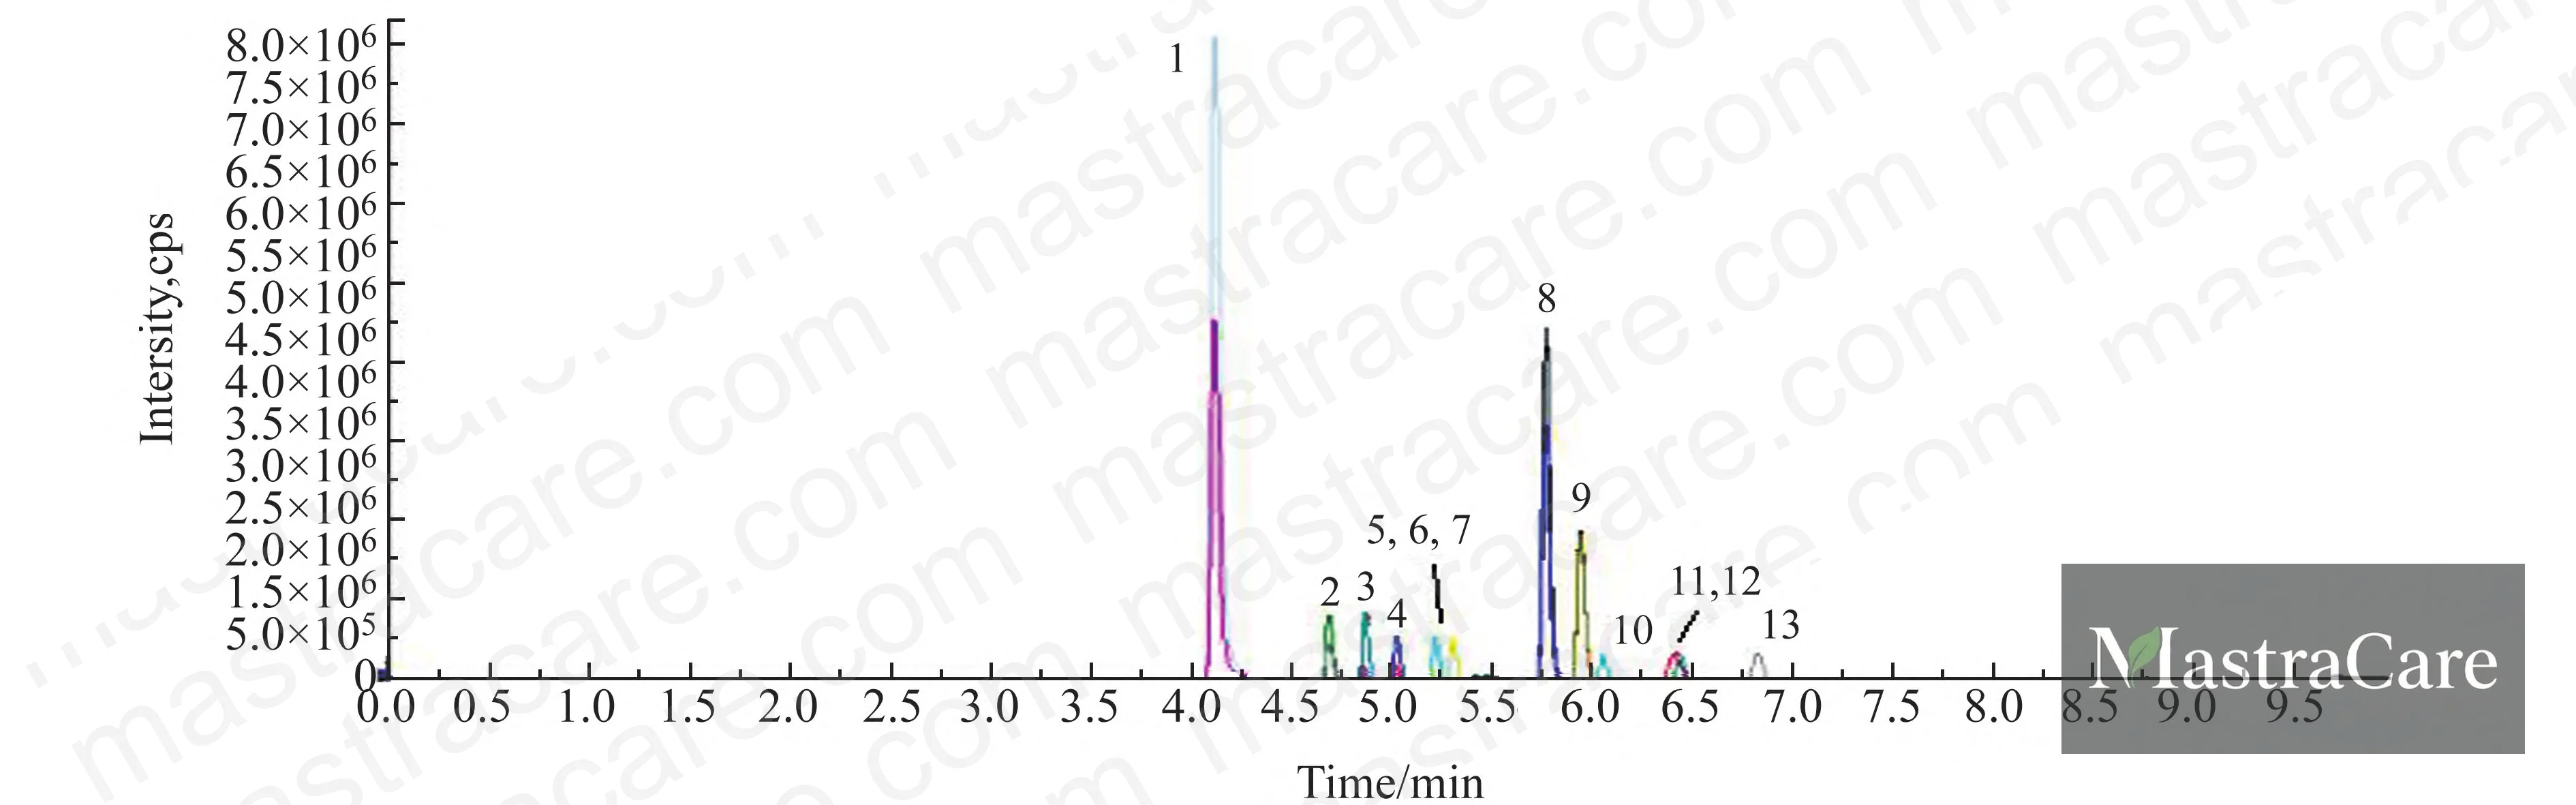
The 13 target compounds span a meaningful range of polarity and molecular weight. Some, like BPS (m/z 249.0) and TCBPA (m/z 364.9), sit at the lighter end of the bisphenol group. Others, like TBBPA (m/z 542.7), are substantially heavier. Getting simultaneous detection of all 13 in a complex cream matrix requires both selective enrichment and careful matrix effect management — neither of which is trivial when your sample is 40–50% lipid and emulsifier.
| Compound | Precursor Ion (m/z) | LOD (μg/kg) | LOQ (μg/kg) |
|---|---|---|---|
| BPS | 249.0 | 0.3 | 1.0 |
| BPA | 227.1 | 1.5 | 5.0 |
| TCBPA | 364.9 | 0.3 | 1.0 |
| TBBPA | 542.7 | 1.5 | 5.0 |
| NP | 219.1 | 1.5 | 5.0 |
| 4-n-NP | 219.1 | 1.5 | 5.0 |
| OP | 205.2 | 1.5 | 5.0 |
Detection limits for BPS and TCBPA reach as low as 0.3 μg/kg — roughly 10× more sensitive than standard HPLC methods applied to the same matrix. For NP and the octylphenol group, the LOD sits at 1.5 μg/kg with quantitation limits at 5.0 μg/kg.
LC-MS/MS Method Validation for Cream Matrix: SPE Conditions, Recovery Data, and Matrix Effects #
Getting clean analytical signal out of a cream extract takes more than running it through a C18 column. The cream matrix carries a significant burden of co-extractable lipids and emulsifiers that suppress ionization in ESI-MS. In this method, the matrix effect coefficients for all 13 compounds ranged from 0.54 to 0.78. Anything outside the 0.8–1.2 range is considered significant suppression, so every single compound in this panel shows meaningful matrix interference. That’s not a method weakness — it’s a practical reality of working with emulsion-based products.
The solution is straightforward but unforgiving in practice: you have to use matrix-matched calibration. External calibration in solvent will give you wrong numbers. The method uses blank matrix extract to prepare all standard curves, which compensates for the suppression effect and brings the final recovery data into acceptable range.
SPE Enrichment and Cleanup Protocol
The extraction uses an ammonia/acetonitrile mixture at a 1:9 (v/v) ratio, with 15 minutes of ultrasonication on a 1.0 g sample in 50 mL centrifuge tubes. After high-speed centrifugation, 1 mL of supernatant is diluted to 10 mL with ultrapure water before loading onto the SPE column.
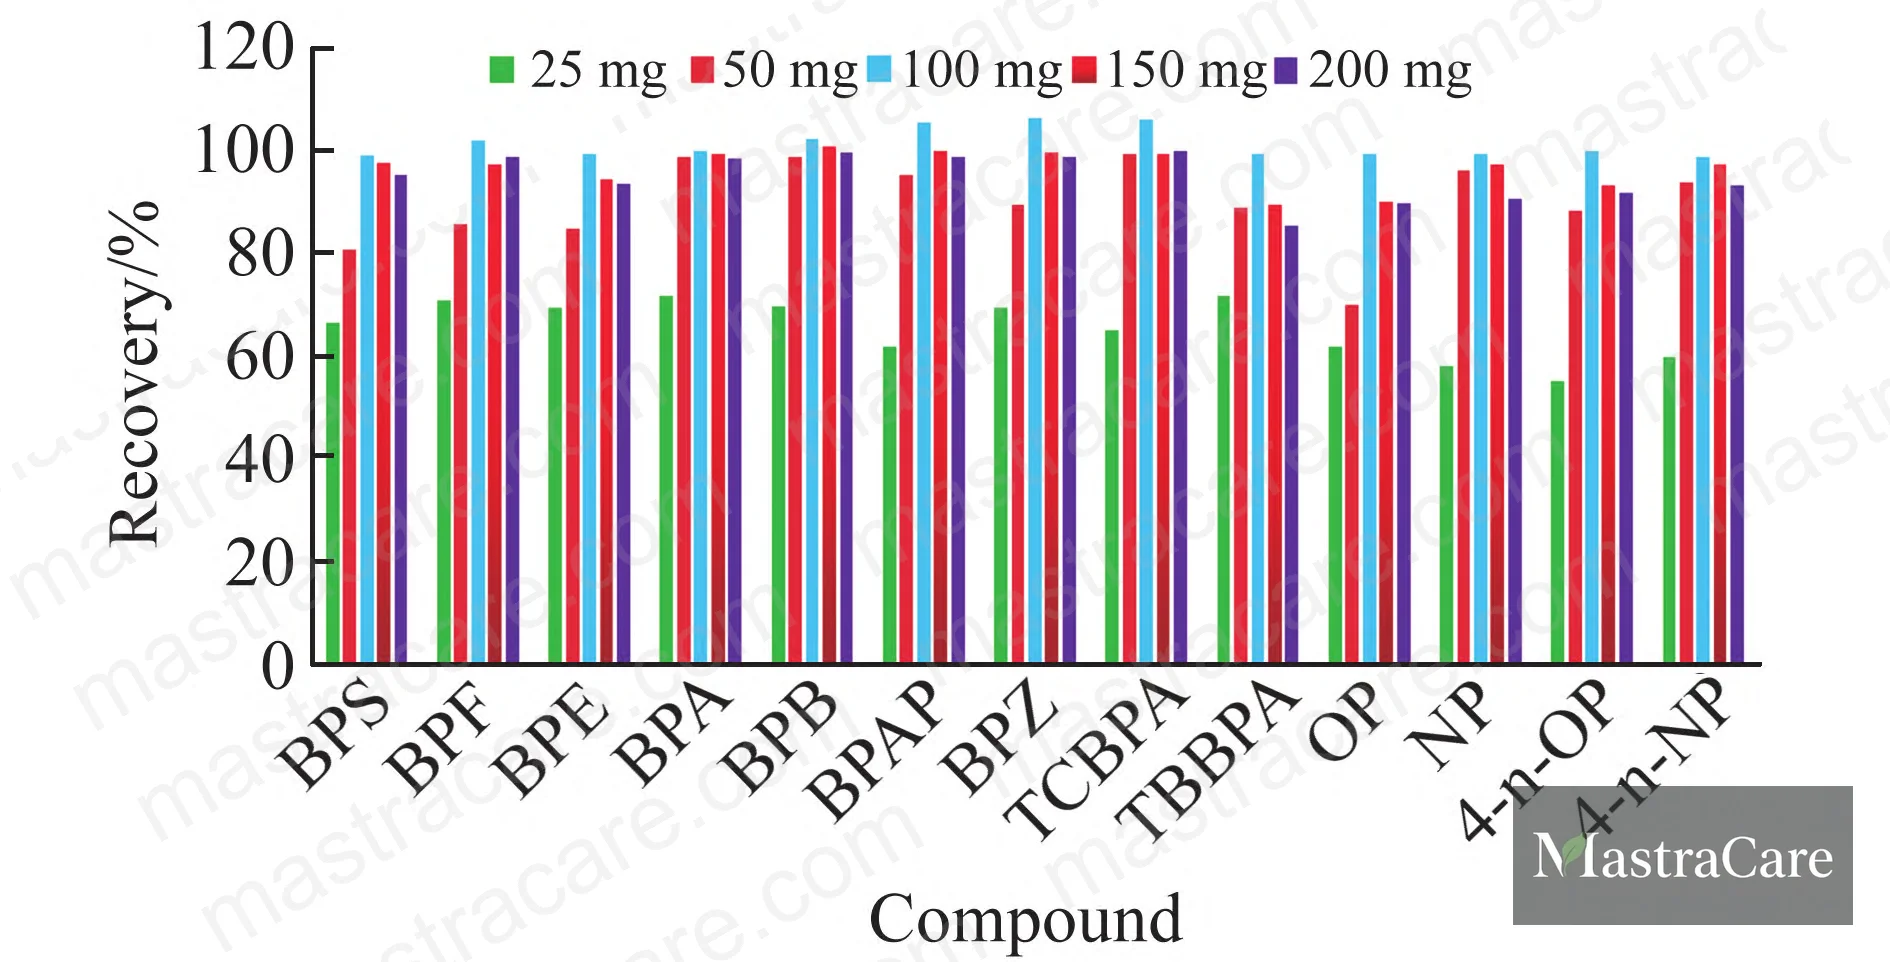
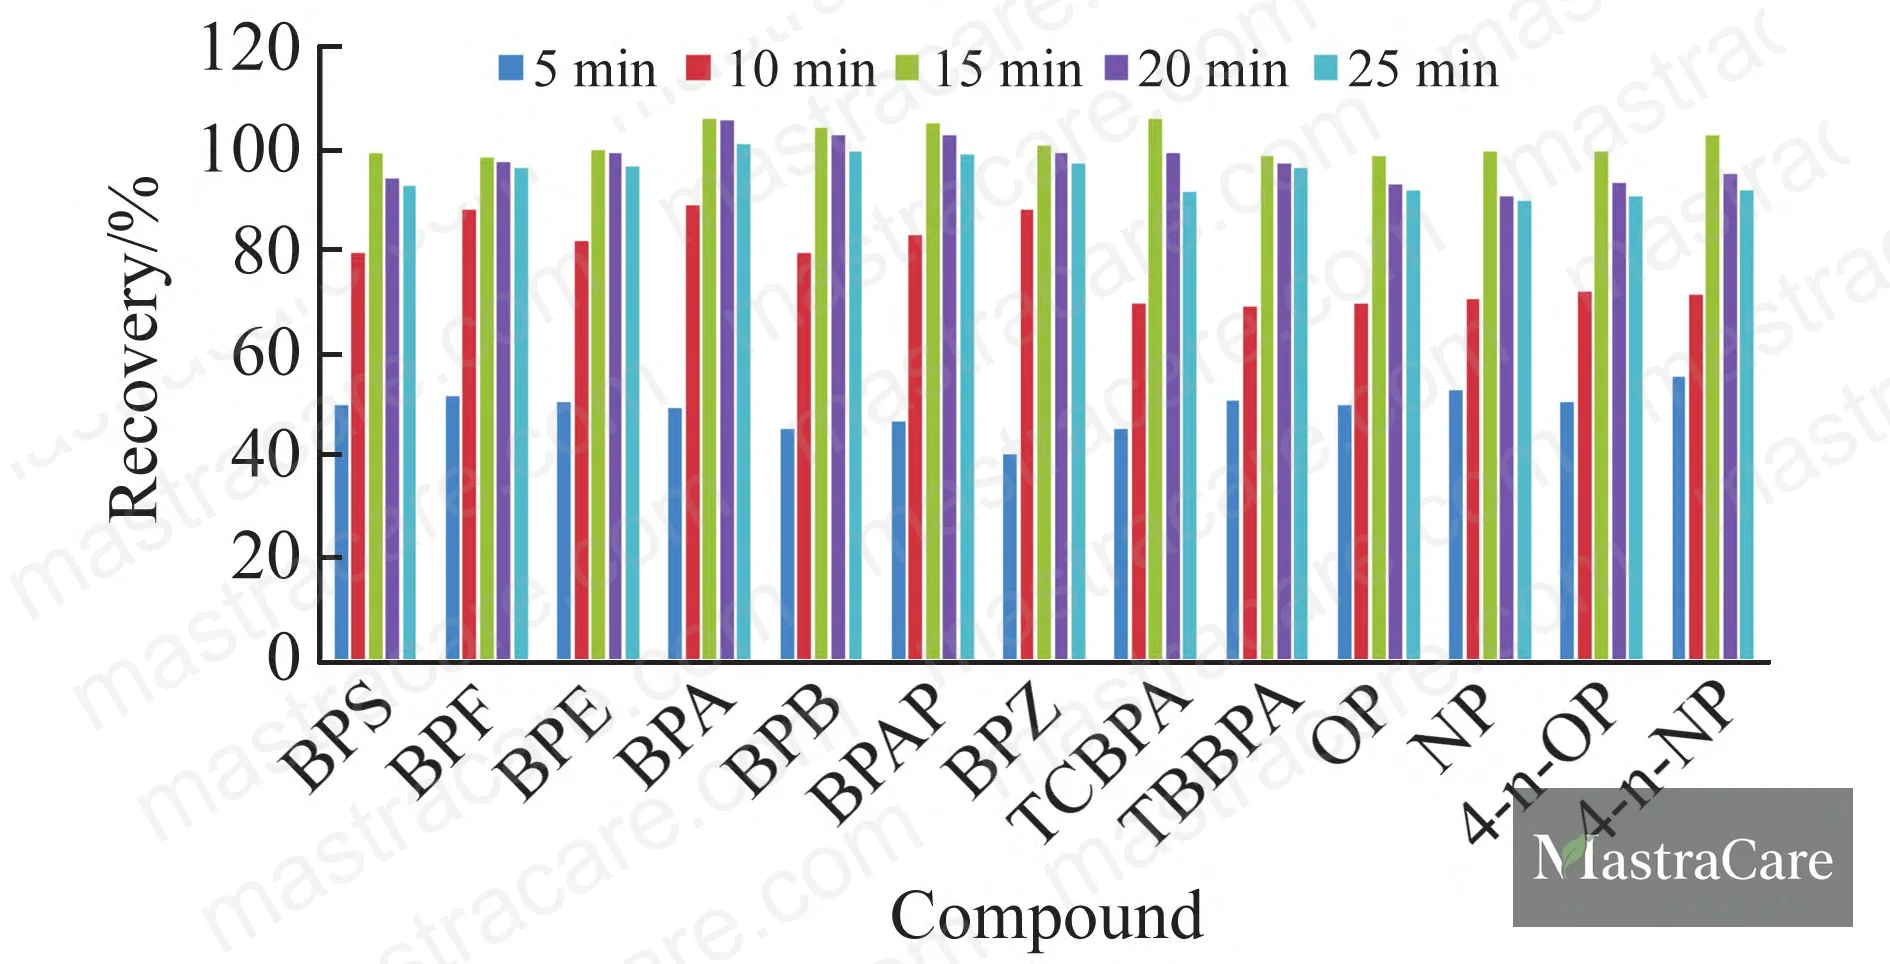
The SPE sorbent is hydroxylated multi-walled carbon nanotubes (OH-MWCNTs) — 100 mg per cartridge. This material was selected specifically for its high surface area and selective adsorption toward phenolic compounds. Optimization data showed that recovery rates plateau at 100 mg loading; below 50 mg, recoveries for several compounds fall off sharply. Adsorption time also matters: recovery stabilizes at 15 minutes, with minimal gain beyond that point.
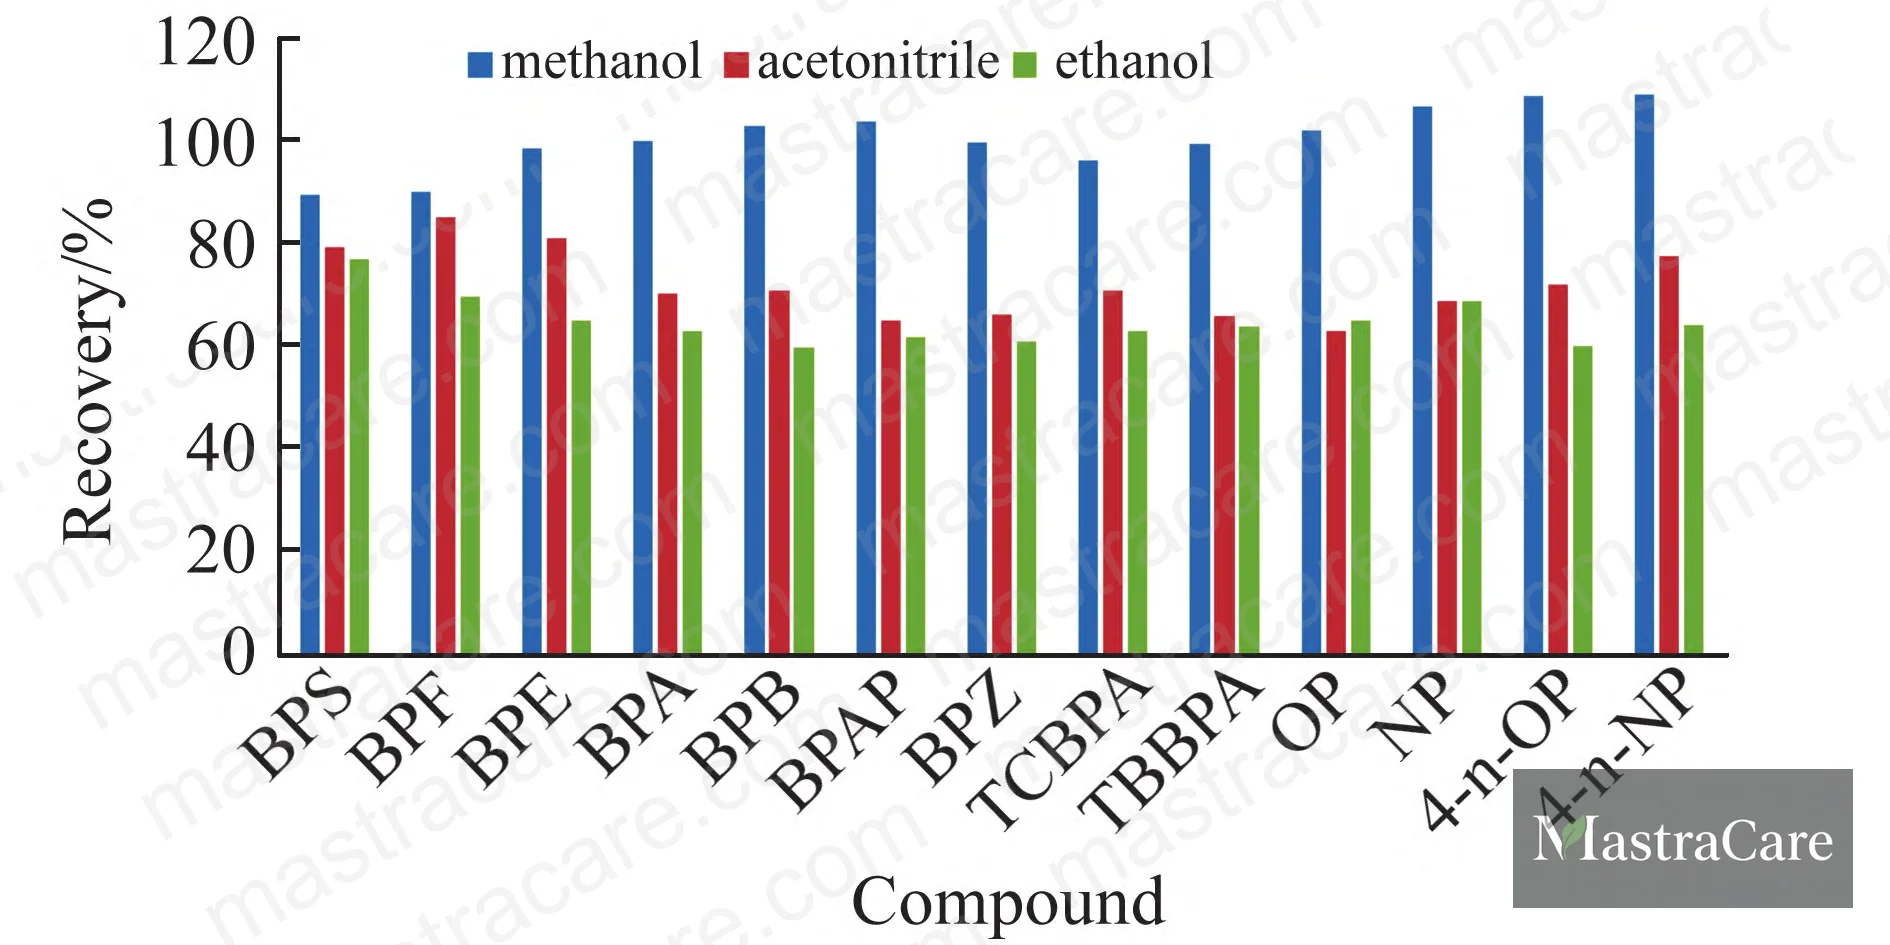
Elution solvent comparison is worth noting. Methanol, acetonitrile, and ethanol were all evaluated. Methanol gave the highest recoveries across all 13 compounds. Volume optimization settled at 1.0 mL — beyond that, dilution effects outweigh any additional elution benefit.
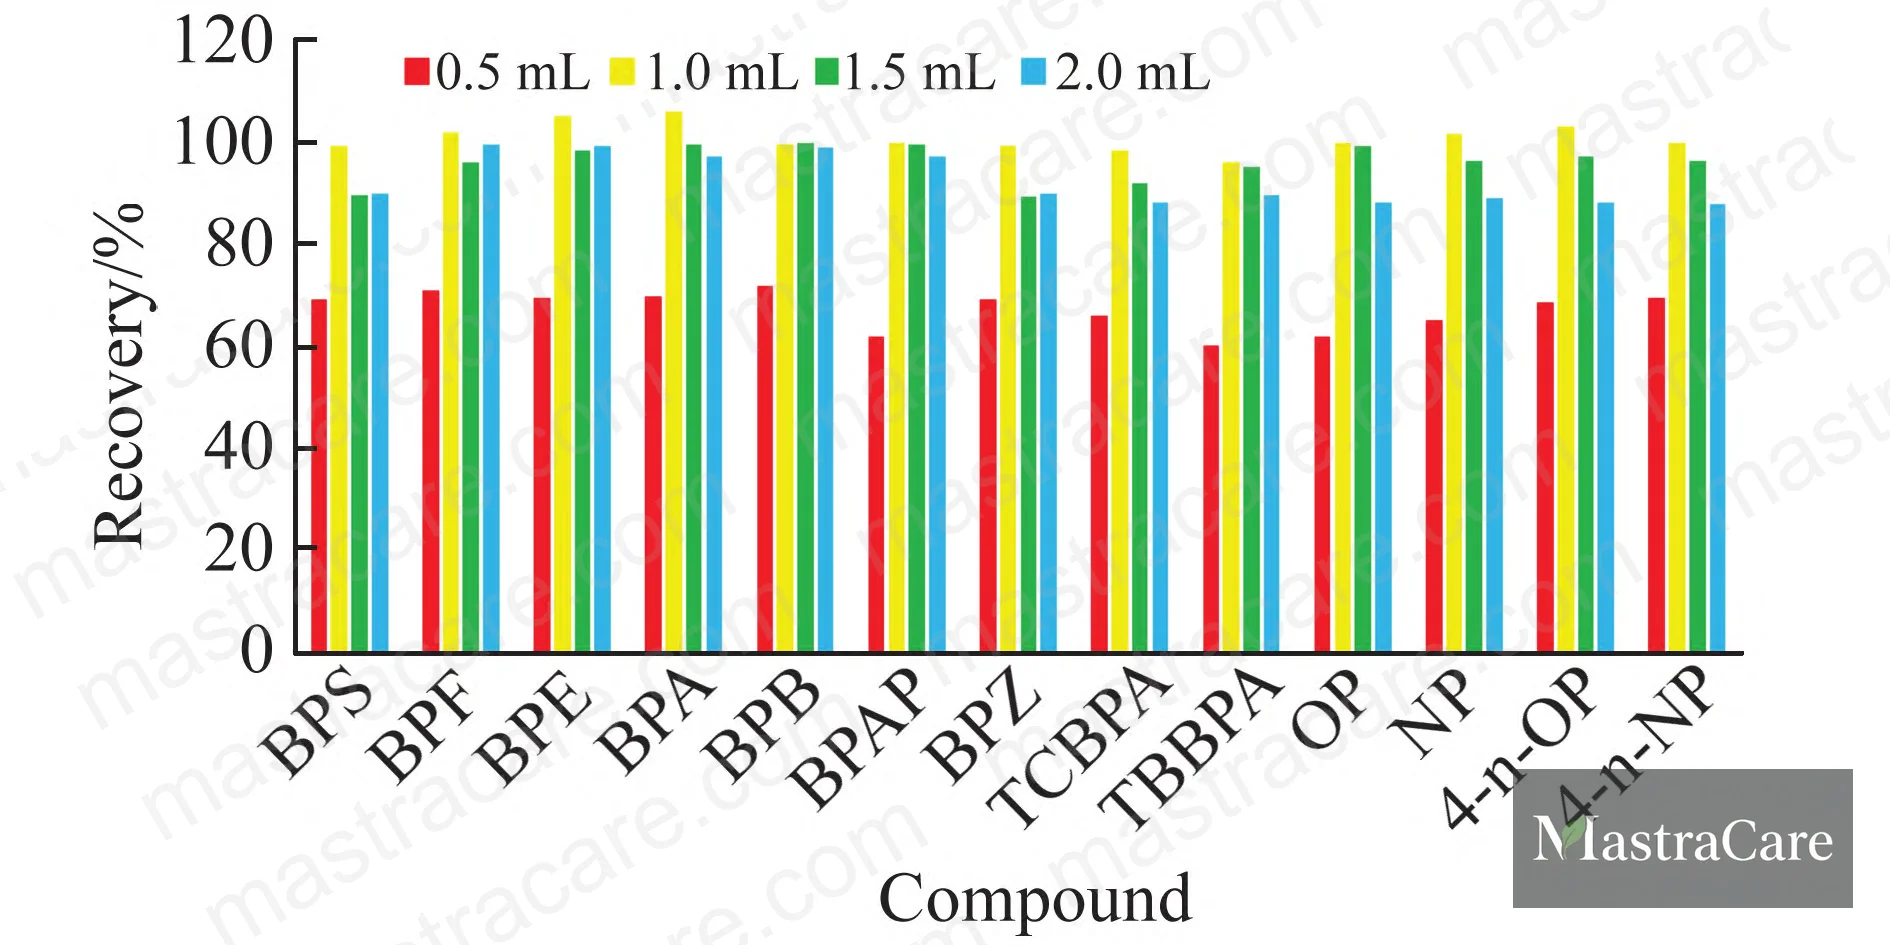
Recovery Performance
Spiked recovery experiments were run at three concentration levels (low/mid/high) across all 13 compounds, with n=6 replicates at each level. Results:
- Overall recovery range: 81.5% to 109.4%
- RSD range: 1.9% to 9.2%
- BPE showed the lowest recoveries (81.5–82.2%), consistent with its relatively low polarity compared to the other bisphenols
- NP showed the highest recoveries (103.5–109.4%), which is notable given that NP is the most commonly detected compound in real samples
The linear correlation coefficients for all 13 compounds ranged from 0.9915 to 0.9996, which is acceptable for this type of complex matrix work. BPS and TCBPA were calibrated over a narrower concentration range (0.2–20.0 μg/L) reflecting their lower anticipated migration levels, while the remaining 11 compounds used a 1.0–100.0 μg/L range.
Honestly, most buyers over-specify method sensitivity in their incoming QC specifications without understanding the matrix effect problem. A method that reports an LOD of 0.3 μg/kg sounds impressive — and it is — but if the calibration isn’t matrix-matched, the quantitative accuracy at that level is unreliable. The method details matter as much as the headline detection limits.
Nonylphenol Migration from Plastic Packaging: Time-Dependent Data #
This is the section that should change how you think about packaging qualification for children’s cream.
The migration experiment was set up using cream known to contain no NP (confirmed by method detection), packaged in NP-positive plastic material. Migration was measured at 10 time intervals: 20, 40, 60, 80, 100, 120, 150, 200, 250, and 300 minutes — at ambient storage temperature. The ratio used was 10 g cream per 1 cm² contact area, per GB/T 38420-2019 methodology.
Results: NP migrated into the cream at every time point tested. Migration rate was fastest during the first 100 minutes, then slowed considerably after 200 minutes, approaching a plateau. This kinetic profile is typical of surface-reservoir depletion — the NP in the plastic layer directly contacting the cream migrates rapidly, then the driving concentration gradient decreases as the surface depletes.
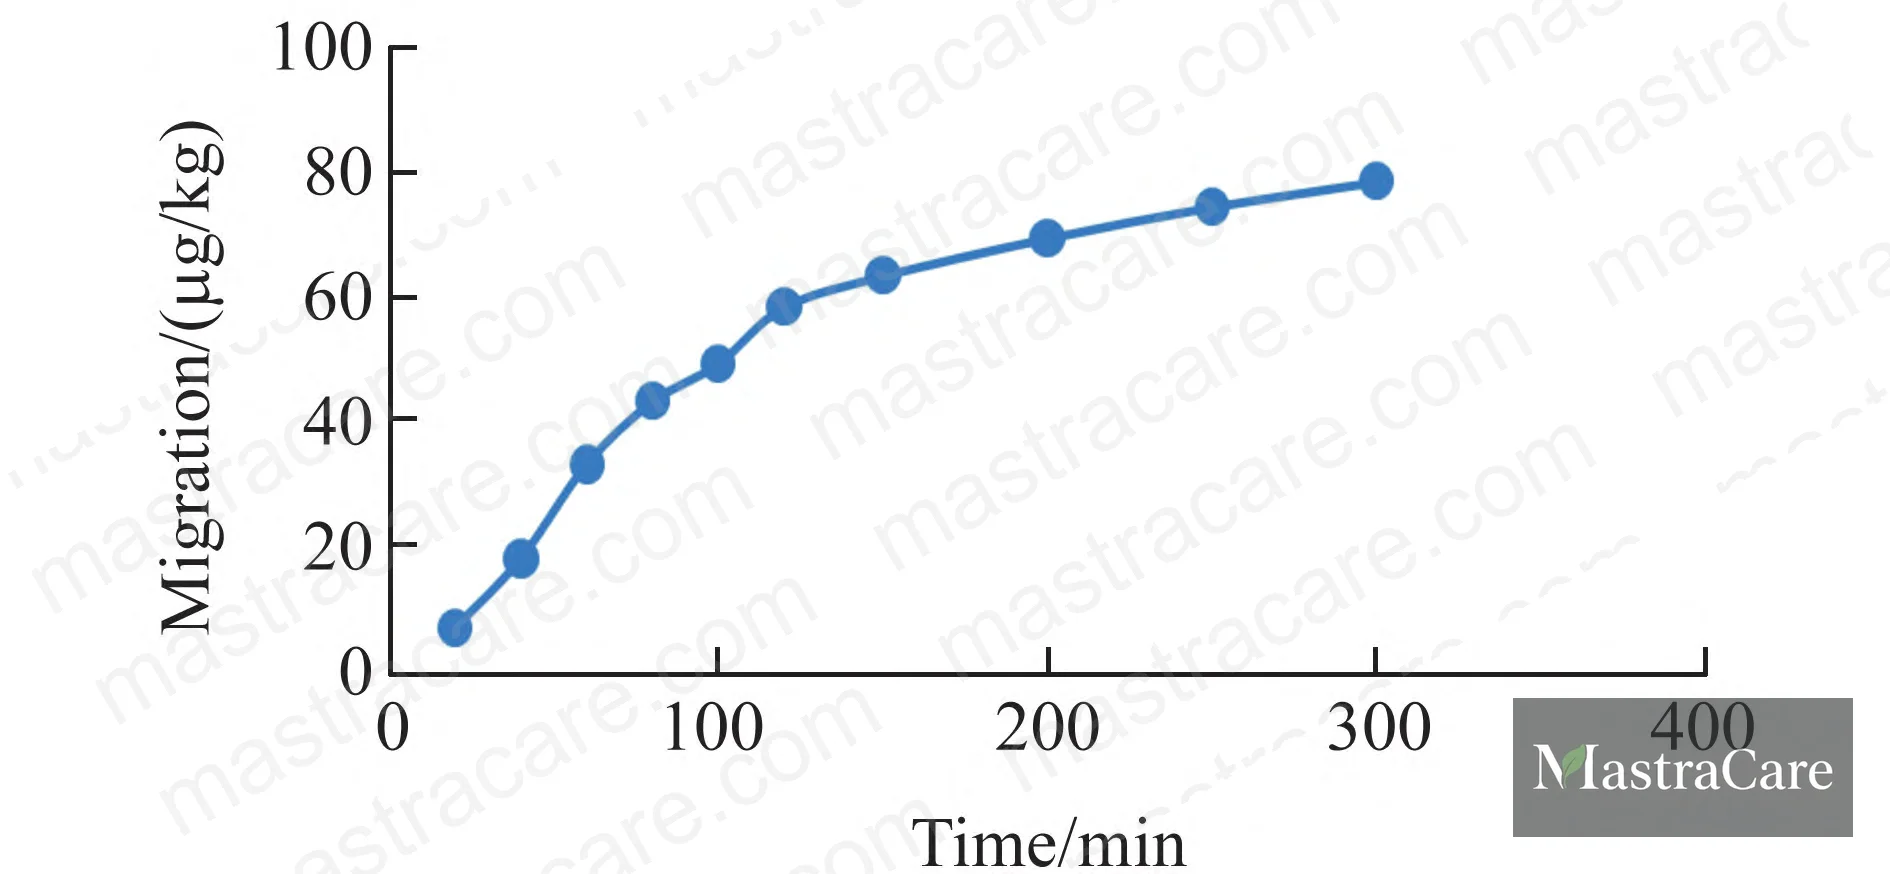
What this means practically: migration is not a long-term storage phenomenon alone. Measurable transfer occurs within the first hour to two hours of product contact with packaging. For children’s cream — a product that may sit in contact with its container for weeks or months before use — the cumulative migration load can be substantial even if per-unit time rates appear small.
Real-Sample Audit Results
In a blind audit of 50 commercial children’s face cream batches sourced from the market, 3 out of 50 batches returned positive for NP. Detected levels: 52.4, 63.8, and 85.4 μg/kg. All three positives are above the 5.0 μg/kg LOQ for NP, giving confidence these are genuine detections rather than noise.
A 6% contamination rate might sound low. In supplier qualification, we’ve seen this pattern before — three of six packaging suppliers tested positive for restricted NP content in their resin, and all three had passed standard incoming material declarations. The contamination wasn’t intentional; it came from recycled-content resin blends where the NP-based surfactant used in upstream processing hadn’t been fully removed. Declaration forms don’t catch that. Only analytical testing does.
This is precisely why packaging qualification should sit inside your formulation compliance scope, not outside it.
Practical Guidance for Buyers #
If you’re developing children’s personal care — cream, lotion, or any emulsion packaged in plastic — the packaging material is part of your safety specification, full stop. Request packaging material composition data that covers plasticizer and process chemical residues, not just the resin type. Specify that NP, BPA, and branched-chain nonylphenols are prohibited not just in the formulation but in all primary and secondary contact packaging materials.
For testing, ask your supplier or third-party lab whether they use matrix-matched calibration for EDC analysis in cream products. If the answer is no, the quantitative data they’re reporting is suspect. The matrix suppression in cream ESI-MS can reduce response signals by 22–46%, which means external-solvent-calibrated results can materially understate actual contamination levels.
At MastraCare, our formulation and OEM manufacturing work for international brand developers and private label buyers includes upstream review of packaging material compliance — we don’t treat it as a separate workstream. If you’re evaluating a children’s cream concept or need to qualify a formulation against EU and China EDC requirements, reach out through our inquiry form to discuss technical requirements before your RFQ.
Buyers sourcing from Guangzhou-area manufacturers in particular should request NP-specific migration data, not just formula certificates of analysis. The recycled resin issue is real and geographically concentrated in certain packaging supply chains.
For internal links to broader formulation and compliance context, see our moisturizer and cream formulation guides and barrier-repair and sensitive skin formulation resources.
Frequently Asked Questions #
Q: Are bisphenol A and nonylphenol banned in cosmetics in China and the EU?
Yes. China’s Cosmetic Safety Technical Specification explicitly lists BPA, NP, and branched-chain 4-nonylphenol as prohibited substances in cosmetic products. The EU Cosmetics Regulation (EC No. 1223/2009) includes them in the banned substances annex. The gap in both frameworks is that neither currently mandates routine migration testing from packaging — which is where real-world exposure occurs.
Q: Why does packaging matter if the formulation itself is clean?
Because prohibited compounds migrate from plastic containers into the cream matrix during storage. The time-dependent migration data here shows NP transferring from NP-positive packaging into clean cream within the first 100 minutes of contact, continuing to accumulate beyond 200 minutes. A clean formula certificate of analysis doesn’t eliminate packaging-source contamination.
Q: What detection method is most appropriate for EDC testing in cream products?
LC-MS/MS in negative ion mode, with multiple reaction monitoring (MRM) and matrix-matched external calibration. The cream matrix produces significant ion suppression in ESI-MS — slope ratios for the 13 compounds in this work ranged from 0.54 to 0.78, well below the 0.8–1.2 threshold considered “low effect.” Any method that doesn’t account for this will underreport actual concentrations.
Q: What’s a realistic detection limit to specify in a supplier quality agreement?
For NP and most alkylphenols: LOD of 1.5 μg/kg, LOQ of 5.0 μg/kg is technically achievable with the SPE-LC-MS/MS method described here. For BPS and TCBPA, LOD can reach 0.3 μg/kg. Specifying “non-detectable” without defining the method and detection threshold is meaningless — always anchor your ND specification to a specific LOQ value.
Q: How should I qualify a packaging supplier for children’s cream against EDC requirements?
Combine three layers: (1) request resin composition declaration covering process chemical residues, not just polymer type; (2) run analytical migration testing per GB/T 38420-2019 or equivalent, using the final filled product or an appropriate surrogate matrix; (3) include periodic surveillance testing in your quality agreement, not just initial qualification. Static declarations don’t capture changes in resin supplier or recycled-content blend ratios over time.
Published by mastracare.com Technical Team | Request a sourcing quote
Content reviewed by rachel.lin | © mastracare.com — All rights reserved. Unauthorized reproduction prohibited.


