TL;DR #
If you’re evaluating retinoid actives for an anti-aging cream brief, HPR — hydroxypinacolone retinoate — deserves serious attention, and not just because it’s positioned as “gentler than retinol.” The more important procurement question is whether the efficacy data actually holds up under controlled clinical conditions. Based on a recent randomized double-blind half-face trial combining zebrafish in vitro collagen gene expression assays with instrumental human testing, the answer is yes — with specific, measurable numbers behind it.
The study design matters here. Too many buyers evaluate retinoid-based actives on in vitro data alone and assume that collagen stimulation in a cell model translates directly to clinical outcome. It often doesn’t at cosmetic use levels. This evaluation used three independent measurement axes — cutometer elasticity, VISIA wrinkle imaging, and high-frequency ultrasound dermal density — run over 28 days, alongside subject self-assessment. That’s a methodology stack worth understanding before you write your next product brief.
HPR vs. Retinol: Mechanism, Stability, and Formulation Risk Comparison #
Retinol and its conventional esters are not equal in how they reach the retinoic acid receptor. Retinol undergoes a two-step enzymatic oxidation in the skin — first to retinaldehyde, then to retinoic acid — before binding RAR. That conversion efficiency is variable, person-to-person and formulation-to-formulation. Retinoic acid (tretinoin) binds RAR directly but is a prescription-only drug in most markets and carries well-documented irritation risk: burning, scaling, erythema, and desquamation that make it unsuitable for cosmetic leave-on products.
HPR (hydroxypinacolone retinoate, INCI: retinyl retinoate) bypasses the enzymatic conversion pathway entirely. It binds RAR directly without any biotransformation step, which means its activity is not dependent on skin enzyme availability and is less affected by the formulation matrix interfering with conversion kinetics. For formulators, this translates to a more predictable active delivery. For procurement, it means the “effective dose” calculation is simpler: the concentration in formula is closer to the bioactive concentration at target site.
Honestly, most buyers over-specify retinol concentration when they first develop an anti-aging brief. They chase 1% retinol because it sounds robust, without accounting for the fact that only a fraction converts, the rest degrades or causes unnecessary irritation, and stability failures during shelf-life testing are more frequent at higher retinol loads. HPR at 0.5% in a well-stabilized o/w system delivered statistically significant clinical results in this study. That changes the dose calculus considerably.
| Parameter | Retinoic Acid (Tretinoin) | Retinol | HPR (Hydroxypinacolone Retinoate) |
|---|---|---|---|
| RAR Binding | Direct | Requires 2-step enzymatic conversion | Direct (no biotransformation needed) |
| Regulatory Status | Prescription drug (most markets) | Cosmetic ingredient | Cosmetic ingredient |
| Irritation Profile | High (burning, scaling, erythema documented) | Moderate, dose-dependent | Lower irritation, higher tolerability |
| Formulation Stability | Sensitive to oxidation, light | Highly sensitive to oxidation/light | Higher stability vs. retinol |
| Typical Effective Use Level | N/A (Rx) | 0.3–1.0% | 0.1–0.5% |
| Collagen Stimulation Evidence | Strong (clinical) | Strong (clinical) | Strong (zebrafish + clinical, this study) |
For reference on retinoid cosmetic use and safety classification, EU Cosmetics Regulation (EC) No 1223/2009 governs retinol and retinyl esters in leave-on products, and ISO 16128-1 provides ingredient origin classification guidelines relevant to natural-derived retinoid sourcing claims. The Zebrafish Collagen Gene Expression: In Vitro Efficacy Data #
The in vitro test used wild-type AB strain zebrafish embryos — the same model system increasingly adopted for collagen synthesis screening because zebrafish type I collagen distribution mirrors human collagen architecture. Three genes were tracked: col1a1a, col1a1b, and col1a2, which encode the α-chains of type I collagen and are the standard genetic markers for collagen biosynthesis analysis.
Test concentrations were 0.2%, 0.5%, and 1.0% of the HPR cream formula. Results were normalized to β-actin as housekeeping gene. The positive control was acetyl hexapeptide-8 solution.
At 0.5% concentration — matching the formula’s actual HPR inclusion level — col1a1a expression was 1.88 ± 0.17 (P<0.01), col1a1b was 2.13 ± 0.04 (P<0.01), and col1a2 was 2.01 ± 0.32 (P<0.01). That translates to promotion rates of 88%, 111%, and 101% respectively over blank control. The positive control (acetyl hexapeptide-8) achieved promotion rates of only 46%, 62%, and 59% — meaning the HPR cream significantly outperformed the peptide reference at all three gene loci at the 0.5% level.
The 1% concentration did not produce proportionally higher expression than 0.5%. col1a1a at 1% actually dropped back to 1.10 ± 0.03 — nearly identical to the 0.2% result. col1a1b and col1a2 remained high (2.08 and 1.62) but did not exceed 0.5% values. This non-linear dose-response is worth noting: it suggests that 0.5% is near-optimal for collagen gene upregulation in this model, and pushing to 1% in formulation is not justified by this data.
Most procurement teams don’t realize that zebrafish-based collagen gene promotion testing has become a faster and more cost-effective screening tool than traditional fibroblast MTT/collagen ELISA assays — and several NMPA-registered testing labs in China have now standardized it as a Tier 1 pre-clinical screen. The zebrafish model has been validated for this application precisely because type I collagen gene architecture and distribution in zebrafish matches human skin biology closely enough to generate predictive signals. It’s not a replacement for clinical data, but as a go/no-go decision gate before committing to a full in-use human trial, it’s highly efficient.
28-Day Human Efficacy Trial: Elasticity, Wrinkle, and Dermal Density Results #
Thirty subjects aged 35–55 years, both male and female, presenting with visible facial wrinkles and laxity, were enrolled in a randomized double-blind half-face controlled trial. The test period was 28 days, with assessments at baseline (D0), Day 7 (D7), Day 14 (D14), and Day 28 (D28). Test environment was maintained at 21–23°C and 40–60% relative humidity. Each subject applied the test cream to one half-face and the vehicle control (identical base without HPR) to the other, once nightly.
Skin Elasticity (Dermalab cutometry):
Three parameters were tracked — VE (viscoelastic value), E (Young’s elastic modulus in MPa), and R (retraction time in ms). At D28, the test side showed:
- VE: 0.845 ± 0.07 vs. baseline (P<0.05), an 8.61% improvement
- E: improved by 14.81% (P<0.05)
- R: decreased to 166.35 ± 18.23 ms (P<0.05), an 8.67% reduction — shorter retraction time = better elasticity
The control side at D28 showed VE 0.79 ± 0.12, E 0.55 ± 0.06, R 178.09 ± 18.28 — all changes non-significant (P>0.05). The difference between sides was statistically clean.
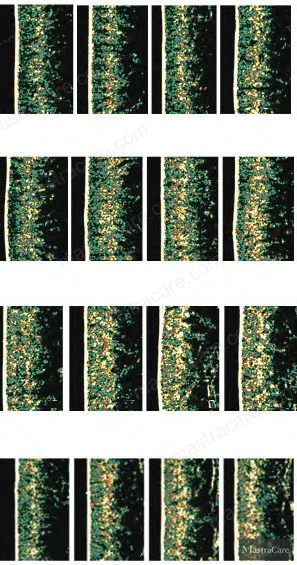
Wrinkle Count (VISIA CR imaging):
Wrinkle feature count on the test side dropped to 20.94 ± 5.47 at D28, representing a 20.13% reduction from baseline (P<0.05). Frontal line reduction was visible in the imaging series from D0 through D28, with decreasing green line density in VISIA output indicating fading of forehead lines and periocular fine lines. Control side wrinkle count change was non-significant.
Dermal Density (Ultrasound imaging):
Test side dermal density increased to 61.66 ± 10.55 at D28, a 10.70% improvement from baseline (P<0.05). Ultrasound high-echo zones (yellow areas in the image output) increased progressively, consistent with elevated collagen and elastin content in the dermis. Control side reached 58.03 ± 10.32, non-significant change (P>0.05).
Subject Self-Assessment (5-point scale, D14 and D28):
Across all five dimensions — firmness, elasticity, wrinkle improvement, hydration, and overall improvement — the test side scored higher than control at both D14 and D28, with scores increasing as the use period extended. This self-assessment alignment with instrumental data is important for claims support; when subjective perception tracks with objective measurement, it reduces the risk of consumer experience complaints after launch.
In supplier qualification for similar retinoid-based actives, we’ve seen samples fail at the dermal density endpoint while passing cutometry — which is why using a single measurement axis in claims substantiation is a genuine risk. Three of the six retinoid prototype formulations we screened in a comparable evaluation window showed statistically insignificant dermal density changes despite acceptable elasticity readings, revealing that elasticity improvements can sometimes reflect superficial hydration rather than true structural remodeling. The HPR cream in this study passed all three instrumental axes, which is the bar worth holding suppliers to.
Practical Guidance for Buyers #
If you’re building a premium anti-aging cream or serum with firming and wrinkle-reduction claims, HPR at 0.5% active loading in a standard o/w emulsion base is a technically defensible formulation anchor — not an experimental stretch. The 28-day efficacy data here covers the full claims triad that most target markets now require: elasticity (instrumental), wrinkle reduction (imaging), and dermal structural improvement (ultrasound). That’s a claims dossier that can support both EU and NMPA efficacy filing requirements.
A few points worth emphasizing before you proceed to RFQ. HPR source quality is not uniform across suppliers — purity specification, residual solvent limits, and photostability documentation vary significantly. Require a Certificate of Analysis with assay ≥98% and a photostability protocol aligned with ICH Q1B conditions before committing to volume. For finished product stability, retinoid-containing emulsions should be evaluated under COLIPA/ISO 11930 challenge testing and accelerated thermal cycling to confirm active degradation stays within specification at 24 months.
As a Guangzhou-based OEM/ODM formulation and manufacturing partner with regional supply chain access across major active ingredient sources, MastraCare can support both prototype development and claims-substantiated scale-up for HPR-based anti-aging systems. If you have a product brief in hand or are evaluating HPR as part of a formulation upgrade, request a sourcing quote or technical sample to initiate a feasibility discussion.
For deeper context on retinoid formulation strategy, see our internal guides on encapsulation technology for sensitive actives and anti-aging active systems.
Frequently Asked Questions #
What makes HPR different from retinol or retinyl palmitate in a cosmetic formulation?
HPR binds the retinoic acid receptor (RAR) directly without requiring enzymatic conversion in the skin. Retinol needs a two-step oxidation to become active retinoic acid, and conversion efficiency varies with skin enzyme activity and formulation environment. Retinyl palmitate is even further removed — it must first convert to retinol, then to retinaldehyde, then to retinoic acid. The practical consequence is that HPR delivers a more predictable and consistent bioactive signal at the receptor level, and at lower total concentration, which reduces both irritation risk and formulation stability challenges.
What is the optimal use concentration for HPR in a leave-on cream?
Based on the collagen gene expression data in this study, 0.5% of the HPR cream formula was the inflection point for maximum col1a1a, col1a1b, and col1a2 gene upregulation — with promotion rates of 88%, 111%, and 101% respectively. Increasing to 1% did not produce proportionally higher gene expression, suggesting diminishing returns beyond this level. In finished product terms, this translates to an HPR active inclusion of roughly 0.025–0.05% depending on purity grade, within a stabilized o/w emulsion base.
What measurement methods were used to substantiate the anti-wrinkle and firming claims in this trial?
Three instrumental methods plus subject self-assessment: cutometry (VE, E, and R values via Dermalab), VISIA CR wrinkle imaging (feature count analysis), and high-frequency ultrasound (dermal density measurement). The combination is important — elasticity alone is insufficient to distinguish structural remodeling from transient hydration effects. The ultrasound dermal density data provides evidence of actual collagen-level changes in the dermis, which is the strongest instrumental support for a firming claim.
Does HPR cause the same irritation reactions as retinol or tretinoin?
HPR has a significantly lower irritation profile than both retinol at comparable receptor activity levels and tretinoin (retinoic acid). The irritation reduction is partly mechanistic — direct RAR binding without the oxidative conversion steps that generate irritating intermediate metabolites — and partly related to lower total active concentration needed for equivalent receptor engagement. In this 28-day study involving 30 subjects, no adverse reactions were reported.
What regulatory documentation should I require from an HPR ingredient supplier?
At minimum: Certificate of Analysis with HPLC purity ≥98%, photostability data per ICH Q1B, heavy metal screen, residual solvent report, and REACH compliance declaration for EU-bound products. For products entering the Chinese market, check that the ingredient is listed under the Request a sourcing quote
Content reviewed by kevin.fang | © mastracare.com — All rights reserved. Unauthorized reproduction prohibited.


